Ask a truck driver about parking and you will hear the same thing: there is nowhere to stop. Ask someone who drives past a rest area at two in the afternoon and they will tell you the lot is half empty. Both are right. We measured it.
Road511 collects the live bay counts that state DOTs publish from their truck-parking sensors. In the four weeks to 13 October 2026 we took an hourly snapshot of 121 public truck-parking sites in Florida, Indiana, Kansas, Wisconsin and New Mexico: rest areas, weigh-station lots and DOT truck-parking facilities. This is what one day looks like.
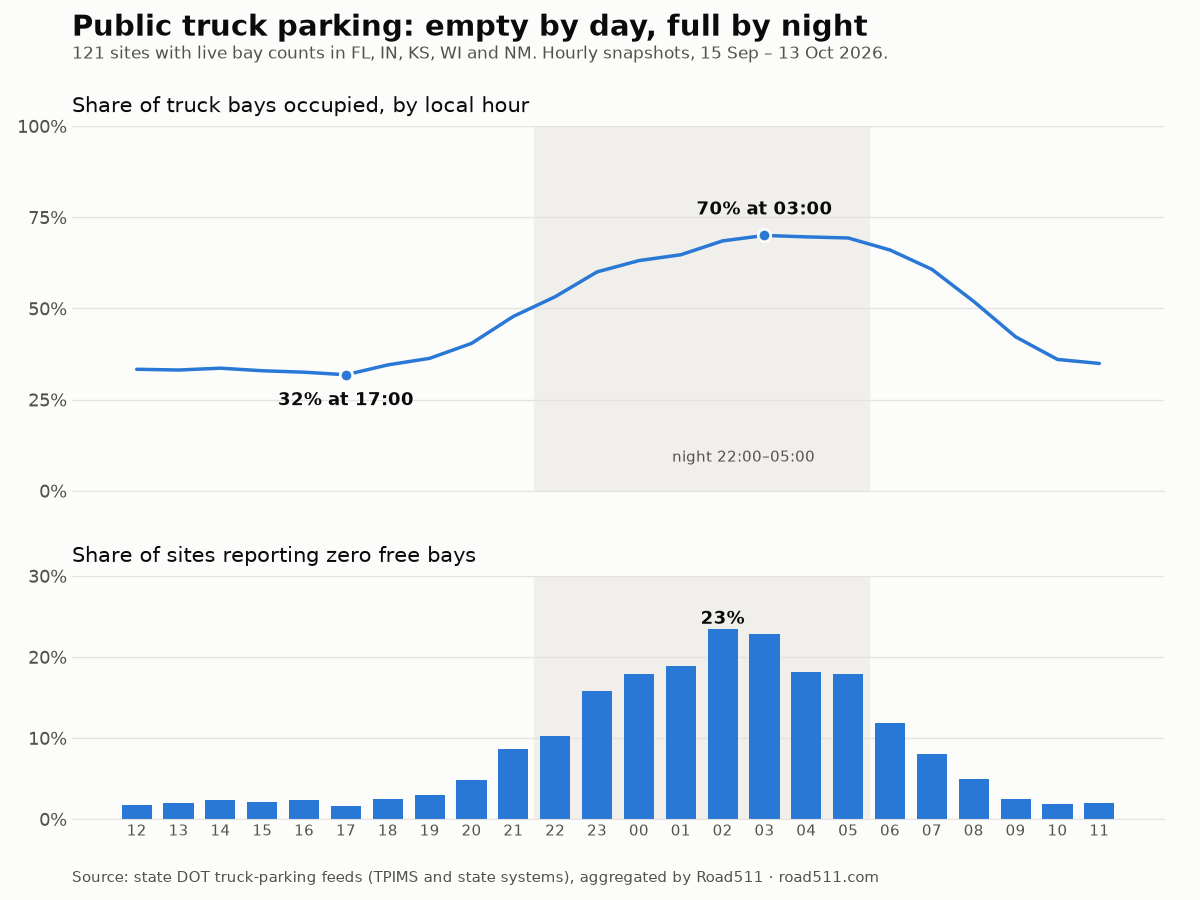
The Numbers
| Local time | Bays occupied | Sites with zero free bays |
|---|---|---|
| 14:00 | 34% | 2% |
| 17:00 (emptiest hour) | 32% | 2% |
| 21:00 | 48% | 9% |
| 23:00 | 60% | 16% |
| 02:00 | 68% | 23% |
| 03:00 (fullest hour) | 70% | 23% |
- The curve does not turn upward until about 19:00. Between 21:00 and 23:00 it climbs fastest, about six percentage points an hour.
- On a weekday at 22:00 the lots are 57% full; on a weekend at the same hour, 43%.
- 76 of the 121 sites hit zero free bays at least once in the four weeks, and 16 were full in at least half of all night hours.
Averaged across the day, these lots are not full at all. They are full at exactly the hour a driver needs them.
Why the Average Misleads
Hours-of-service rules put most drivers’ 10-hour break in the same window, late evening into night. Demand for a parking bay does not spread evenly over 24 hours. It piles up in about eight of them. A lot that sits at 33% for ten straight daytime hours is not oversupplied. It is waiting for the night shift.
That is why “we need more parking” and “the lots are empty” can both be said in good faith. Each side is looking at a different hour of the same curve.
What a Driver Actually Needs to Know
A map of where the parking is solves the wrong problem. At 14:00 every pin on that map has space. The question a driver or dispatcher faces is different: will this lot still have a bay when I get there at 23:00?
That question has three parts, and the data to answer each one already exists:
- Where the bays are along the route, and on which side of the highway.
- How many are free right now, with the timestamp of the reading, so a stale count is obvious.
- How this lot usually fills by hour, so “12 free at 20:00” can be read as “likely full by 23:00”.
The third part is the one a driver usually does not get, and it is the one that turns a parking app into a planning tool. The pattern is strong and it repeats. Indiana’s lots run at about 34% at 14:00 and about 82% at 03:00.
Moving to the Next Lot Rarely Helps
We also checked what happens when a lot is full at night: are there free bays at another site nearby? In 64% of those full hours there was at least one free bay within 50 km. But the median number of free bays in that radius was 6. Moving on to the next lot is sometimes possible. It is not a strategy. The real lever is timing: deciding at 18:00 where to stop, not at 22:30.
What This Data Does and Does Not Cover
- Public sites only. These are state-run rest areas and truck-parking lots with sensors. Private truck stops are not in this data, and we make no claim about how full they run.
- Five states. Florida accounts for 59 of the 121 sites. Other states publish live counts too, and some of them do not publish capacity, which an occupancy figure needs.
- Sensors fail. We excluded seven Florida sites that report zero free bays for most of the daytime as well. They may be broken sensors or genuinely saturated lots, and the overall curve moves by about one point with or without them.
- Hourly snapshots. Feeds report changes, not a fixed cadence. For each site and hour we used the latest reading no older than six hours.
Using the Data
The live counts behind this chart come through the same Road511 API as everything else: one schema across every state that publishes, the timestamp of each reading, and a corridor query that returns the parking along a route. The routing endpoint goes one step further. Request parking_trend, and every lot on the route and every suggested HOS stop comes back with typical_occupancy: what that lot’s history says about the hour the truck is projected to arrive, not how many bays are free right now.
POST /api/v1/routing/route
{
  "origin":      { "lat": 39.7684, "lng": -86.1581 },
  "destination": { "lat": 38.2527, "lng": -85.7585 },
  "departure_time": "2026-10-13T21:31:00-04:00",
  "truck": { "profile": "tractor" },
  "include": ["summary", "parking_trend"],
  "enrichment": { "include_features": ["truck_parking"] }
}

"features": [
  {
    "type": "truck_parking",
    "name": "I-65 Henryville, IN 47126 (Henryville)",
    "distance_along_route_m": 144879,
    "detour_m": 167,
    "side": "right",
    "available_spots": 0,
    "capacity": 58,
    "typical_occupancy": {
      "hour": 3, "avg_available": 12.8, "avg_capacity": 58,
      "samples": 88, "low_samples": 0
    }
  }
]
hour is the UTC hour of the projected arrival: this truck reaches Henryville at about 23:00 Eastern. How the parking endpoints work is described in Truck Parking Availability on the Route, Before the Clock Runs Out, and the HOS side in HOS break planning on the route.
Plan the stop for the hour the truck arrives
Live bay counts from every state that publishes them, in one schema, with the typical occupancy for the hour of arrival on every lot along the route. Free 14-day trial. No credit card.
Get Free API Key See the Live Map